Your API is up, but users say checkout feels slow. CPU looks normal. The database is not down. Logs show a few timeouts, but they do not tell you whether this is one bad request or a growing production incident.
Application performance monitoring (APM) is how teams measure whether an application is healthy in real time: latency, error rates, throughput, dependency behavior, and user impact. This guide explains what application performance monitoring is, how it works, which signals matter most, and why it complements logs instead of replacing them.
If you are following the learning path, read How Logging Works in Backend Systems, What Is High Availability?, and What Is a Message Queue? Simple Explanation with Examples alongside this post. For the broader roadmap, use the Practical Backend Engineering series as the pillar page and the Backend tag as a category page.
Table of Contents
Open Table of Contents
- What Is Application Performance Monitoring (APM)?
- Why Application Monitoring Matters in Production
- Monitoring vs Logging vs Tracing
- The Core Signals You Should Monitor
- How an Application Monitoring Pipeline Works
- Uptime Checks, Dashboards, and Alerts
- A Practical Node.js Metrics Example
- Real-World Examples
- Common Monitoring Mistakes
- Interview Questions
- 1. What is application performance monitoring?
- 2. What is the difference between monitoring and logging?
- 3. Why are percentiles better than average latency?
- 4. What metrics would you monitor first for a new API?
- 5. Why is alerting difficult to get right?
- 6. Can a system be available but still unhealthy?
- Conclusion
- References
- YouTube Videos
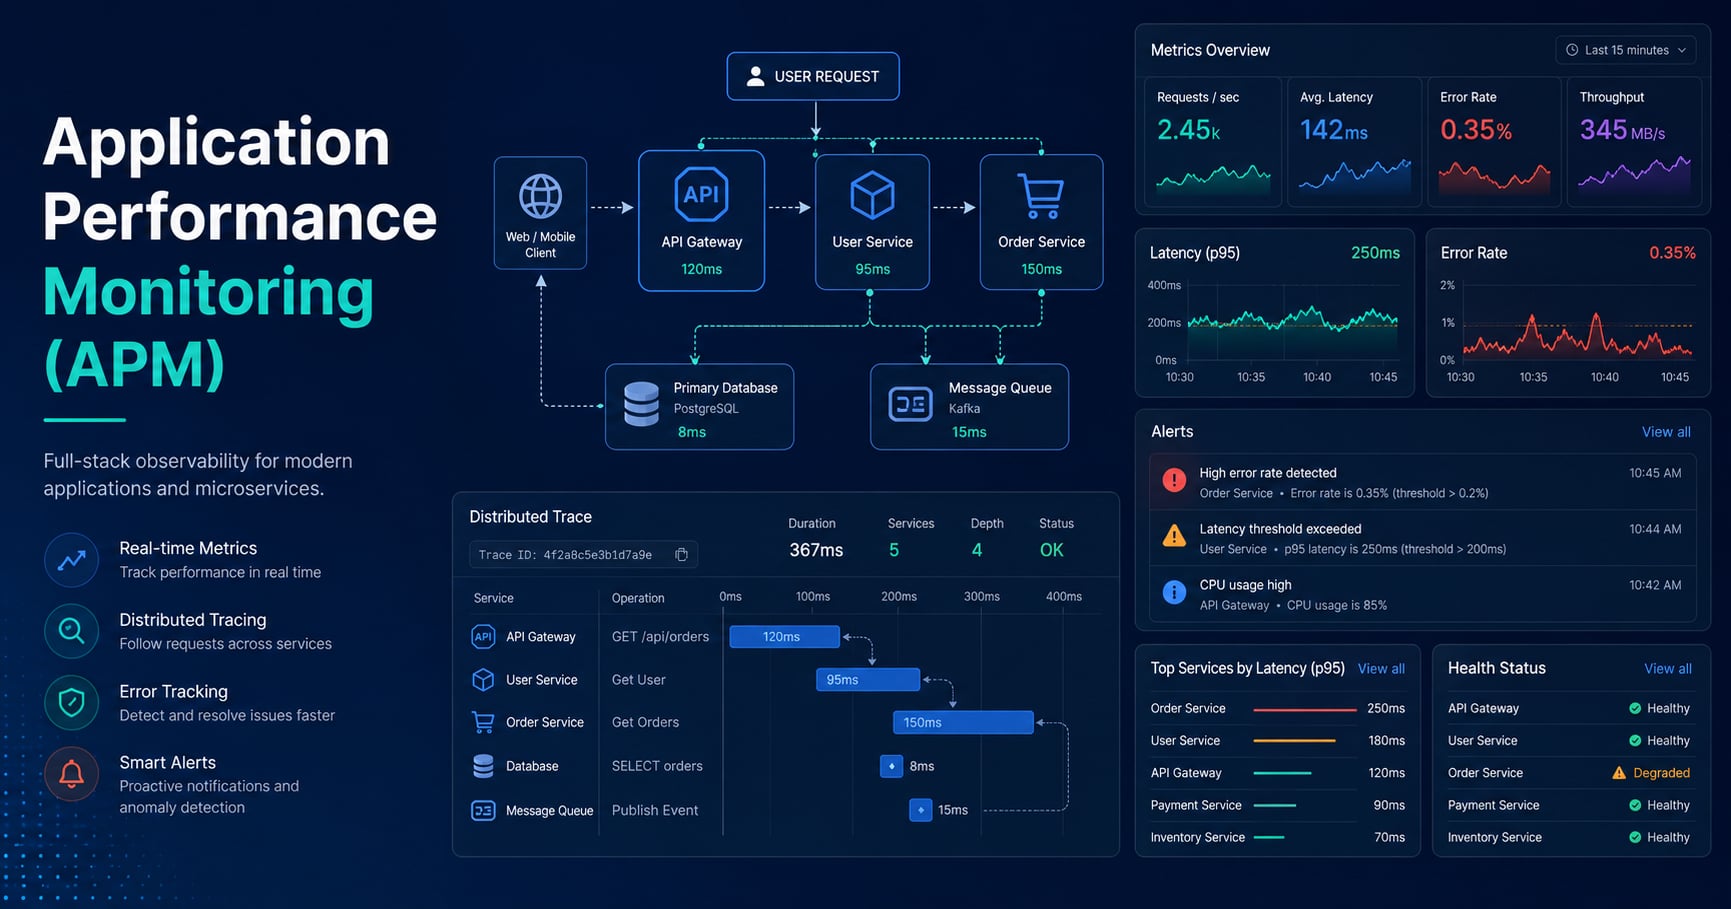
What Is Application Performance Monitoring (APM)?
Application performance monitoring, usually shortened to APM, is the practice of collecting telemetry from a running application so teams can detect slowdowns, failures, and unhealthy trends before users feel too much damage.
The important phrase is running application. APM is not about what the code should do in theory. It is about what the application is doing right now under real traffic, real dependencies, and real production conditions.
At a minimum, APM tries to answer questions like these:
- How fast are requests right now?
- Is the error rate rising?
- Which endpoint or dependency is slow?
- Are we close to saturation?
- Did the latest deployment make things better or worse?
That is why APM sits between pure infrastructure monitoring and detailed debugging. CPU and memory alone are not enough, because a system can have healthy servers and still deliver a bad user experience. Raw logs alone are not enough, because they are event-level evidence, not a fast health summary.
When I explain APM to beginners, I usually say: logging tells the story of individual events, while monitoring tells you whether the system as a whole is drifting into trouble.
Why Application Monitoring Matters in Production
Production problems rarely announce themselves clearly. Users do not open a ticket saying, “your p95 latency rose from 220ms to 1.8s after the last deploy.” They say, “the app feels broken.”
Application monitoring matters because it converts vague production pain into measurable signals. Instead of guessing, the team can see:
- response time is rising
- error rate is spiking
- one downstream service is timing out
- queue backlog is growing
That operational visibility changes how teams respond.
Without monitoring, incidents tend to be reactive. Someone notices a complaint, checks a dashboard too late, and starts piecing things together from logs and intuition. With monitoring, the system can raise an alert when latency or errors cross a threshold, often before the issue becomes widespread.
This also connects directly to availability. As explained in What Is High Availability?, uptime alone is not the full user experience. A service that returns 200 OK responses in 12 seconds is technically available but practically unhealthy. Monitoring helps teams catch degraded performance before it becomes a visible outage.
Monitoring vs Logging vs Tracing
Beginners often bundle all observability data together, but each signal answers a different question.
| Signal | Best for | Example question |
|---|---|---|
| Metrics / monitoring | Fast health overview and alerting | Are checkout errors rising right now? |
| Logs | Event details and debugging context | Why did request req_42 fail? |
| Traces | Request flow across services | Which downstream call made checkout slow? |
Metrics are compact and cheap to query, which makes them ideal for dashboards and alerts. Logs are richer and more narrative, which makes them ideal for explaining a specific failure. Traces show the path of a request through multiple components and help isolate where time was spent.
This is why the strongest production setups do not pick one signal and ignore the others. They combine them. A dashboard might show that latency is rising. A trace might reveal that payment-service calls became slow. A log line might show the provider timeout code that explains the root cause. That same relationship shows up in How Logging Works in Backend Systems: logs are essential, but they do not replace metrics or traces.
The Core Signals You Should Monitor
If you monitor everything without prioritizing, you usually create noise instead of clarity. The better approach is to start with a small set of high-value signals.
1. Latency
Latency is how long the application takes to respond. This is often the first thing users notice when it gets worse.
Do not watch only average latency. Averages hide pain. One hundred fast requests and a handful of terrible ones can still produce a pleasant average while some users are suffering badly. Percentiles such as p95 and p99 are more useful because they show tail latency.
2. Traffic or throughput
Traffic tells you the level of demand on the system. That might be requests per second, jobs per minute, messages consumed per second, or another workload-specific rate.
Traffic matters because performance numbers have context only when demand is known. A database can look perfect at 50 requests per second and fall apart at 2,000. Throughput is the baseline you need before interpreting most other signals.
3. Error rate
Error rate measures how much work is failing. That includes explicit failures like 500 responses, but it can also include timeouts, failed queue jobs, or rejected downstream calls.
Error rate is often the clearest alerting signal because it maps well to user-visible pain. If you also care about asynchronous systems, error rate should include worker failures and retry storms, not just synchronous HTTP requests. That is especially important in queue-backed architectures like the ones covered in What Is a Message Queue? Simple Explanation with Examples.
4. Saturation
Saturation tells you how close the system is to running out of headroom. CPU, memory, disk I/O, connection pool exhaustion, queue backlog age, and thread pool utilization all fit here.
This is the “we are about to be in trouble” signal. Latency and errors often become visible only after saturation has already been rising for a while.
5. Dependency health
Modern applications depend on databases, caches, queues, and third-party APIs. If you only watch the API layer, you miss where failures originate.
Useful dependency metrics include:
- database query latency
- cache hit rate
- outbound HTTP error rate
- queue depth
- age of oldest queued message
These signals help separate “our code is slow” from “our application is blocked on something else.”
How an Application Monitoring Pipeline Works
At a high level, monitoring usually follows this path:
flowchart TD
    A[Application Code] --> B[Instrumentation Library]
    B --> C[Metrics and Trace Export]
    C --> D[Collector or Scraper]
    D --> E[Monitoring Backend]
    E --> F[Dashboards]
    E --> G[Alerts]
    F --> H[Developer Investigation]
    G --> H
Here is the same flow in plain English:
- The application is instrumented to expose telemetry such as request duration, error count, or dependency timings.
- A collector, agent, or scraper gathers that telemetry on an interval or receives it as it is emitted.
- The data is stored in a monitoring backend such as Prometheus, Grafana Cloud, Google Cloud Observability, Datadog, New Relic, or another APM platform.
- Dashboards summarize service health over time.
- Alert rules notify the team when signals move outside acceptable thresholds.
- Engineers then use logs and traces to drill into the incident.
The exact tooling varies, but the workflow stays surprisingly consistent. First you measure, then you visualize, then you alert, then you investigate.
Uptime Checks, Dashboards, and Alerts
Application monitoring is not just “collect some metrics.” The operational value appears when those metrics are organized into checks, dashboards, and alert rules that match real business risk.
Uptime checks
Uptime checks answer the simplest question: can a client reach the system at all? They are useful, but they are only a baseline. A passing uptime check does not guarantee that login, checkout, or search is healthy.
Dashboards
Dashboards help teams see system state quickly. A good service dashboard usually includes:
- request rate
- p95 latency
- error rate
- saturation or resource headroom
- dependency status
The goal is not to produce beautiful charts for their own sake. The goal is to make the first 60 seconds of an investigation faster.
Alerts
Alerts should fire when user impact or clear risk exists, not every time a metric wiggles.
Good alert design usually means:
- alert on sustained problems, not one noisy sample
- prefer user-impact signals such as latency and errors
- separate warning from critical severity
- route alerts to someone who can act on them
One common beginner mistake is alerting on raw CPU alone. High CPU may be normal during expected traffic. If latency, errors, and saturation are all healthy, that CPU spike may not require action. Better alerting combines technical signals with service behavior.
A Practical Node.js Metrics Example
Here is a small Express example using prom-client to expose application metrics for Prometheus scraping.
import express from "express";
import client from "prom-client";

const app = express();
const register = new client.Registry();

// Default process metrics help catch resource pressure early.
client.collectDefaultMetrics({ register, prefix: "checkout_api_" });

const httpDuration = new client.Histogram({
  name: "checkout_api_http_request_duration_seconds",
  help: "Duration of HTTP requests in seconds",
  labelNames: ["route", "method", "status_code"],
  buckets: [0.05, 0.1, 0.25, 0.5, 1, 2, 5],
});

const httpErrors = new client.Counter({
  name: "checkout_api_http_errors_total",
  help: "Total number of failed HTTP requests",
  labelNames: ["route", "method"],
});

register.registerMetric(httpDuration);
register.registerMetric(httpErrors);

app.get("/checkout", async (req, res) => {
  // Start the timer before any real work so latency includes app code and dependencies.
  const stopTimer = httpDuration.startTimer({
    route: "/checkout",
    method: req.method,
  });

  try {
    await new Promise(resolve => setTimeout(resolve, 120));
    res.json({ status: "ok" });
  } catch (error) {
    // Incrementing a counter makes failure trends visible in dashboards and alerts.
    httpErrors.inc({ route: "/checkout", method: req.method });
    res.status(500).json({ error: "checkout_failed" });
  } finally {
    // Recording the final status code lets you split success latency from failure latency.
    stopTimer({ status_code: String(res.statusCode) });
  }
});

app.get("/metrics", async (_req, res) => {
  res.set("Content-Type", register.contentType);
  res.end(await register.metrics());
});

app.listen(3000, () => {
  console.log("Server listening on http://localhost:3000");
});
This example is small, but it captures the core pattern:
- instrument the request path
- expose metrics in a machine-readable format
- let a monitoring system scrape them
- build dashboards and alerts on top
The important part is not Prometheus specifically. The important part is learning to publish stable service metrics that tell you about user experience and failure trends.
Real-World Examples
1. API latency monitoring
A payment API may monitor p50, p95, and p99 latency for /checkout, /refund, and /webhook endpoints separately. That matters because averages blur important details. One fast endpoint can hide another endpoint that is failing customers.
2. Worker and queue monitoring
A background worker system may expose queue depth, retry count, and age of oldest message. This is a common blind spot. The API may look healthy while asynchronous work is quietly falling behind for hours.
3. Dependency-centric monitoring
A product team may discover that “slow checkout” is actually “slow tax provider calls” or “database pool exhaustion.” Good APM breaks the application into parts so the team can see whether the bottleneck is local code, a downstream service, or simple resource pressure.
Common Monitoring Mistakes
1. Monitoring only infrastructure
CPU, memory, and disk are useful, but they are not the same as application health. A backend can have plenty of free CPU and still produce slow responses because of a slow database or a broken third-party API.
2. Using averages as the main latency signal
Average latency is too forgiving. Tail latency matters because users experience individual slow requests, not the mean of a chart.
3. Creating dashboards with no alert strategy
If nobody looks at a dashboard until users complain, the monitoring setup is incomplete. Dashboards and alerts work together.
4. Alerting on every small fluctuation
Over-alerting trains teams to ignore alerts. A useful alert should mean “something important is wrong or about to be wrong.”
5. Ignoring asynchronous workloads
Teams often monitor HTTP endpoints well and forget workers, cron jobs, queues, and scheduled tasks. That leaves a large operational blind spot in real backend systems.
6. Treating monitoring as a replacement for logs
Monitoring tells you that something is failing. Logs usually tell you what actually happened. Production debugging is much faster when both are present and correlated.
Interview Questions
1. What is application performance monitoring?
Application performance monitoring is the practice of measuring how a running application behaves in production so teams can detect and diagnose problems quickly. It focuses on signals such as latency, traffic, error rate, dependency behavior, and saturation. I would emphasize that APM is not just server monitoring because it is centered on application health and user experience. The real value is moving from reactive debugging to early detection and faster incident response.
2. What is the difference between monitoring and logging?
Monitoring summarizes system health through metrics and trends, while logging records detailed events that happened at specific times. Monitoring is better for dashboards and alerting because it is fast to aggregate and query. Logging is better for understanding the exact details of a failure after the monitoring system tells you something is wrong. In practice, strong production systems use both because they answer different operational questions.
3. Why are percentiles better than average latency?
Percentiles show how slow the worst slice of requests is, which is much closer to what real users feel. An average can look healthy even when an important minority of requests is painfully slow. That means p95 or p99 often reveals issues that averages hide, especially during partial failures or noisy neighbor conditions. I usually explain that averages are easy to read but dangerous to trust alone.
4. What metrics would you monitor first for a new API?
I would start with request rate, p95 latency, error rate, and a saturation signal such as CPU, memory, or connection pool usage. Then I would add dependency metrics for the database, cache, and external APIs because many production incidents originate there. This gives a compact but high-signal view of whether the service is healthy, overloaded, or blocked on something else. After that foundation is in place, I would add more domain-specific metrics such as checkout success rate or queue backlog age.
5. Why is alerting difficult to get right?
Alerting is difficult because noisy alerts create fatigue, while weak alerts miss real incidents. Good alerting must reflect user impact, service expectations, and the team’s ability to act. I prefer sustained threshold rules, severity levels, and clear ownership rather than a flood of one-off notifications. The goal is not maximum sensitivity; it is useful signal with minimal wasted attention.
6. Can a system be available but still unhealthy?
Yes. A system may still return responses and pass uptime checks while being too slow or error-prone for users to rely on it comfortably. That is why operational health cannot be reduced to “is the server up?” alone. Monitoring needs to include latency and failure behavior, not just binary reachability. This distinction becomes very important in high-availability discussions because degraded service quality is often the first visible warning before a harder outage.
Conclusion
- Application performance monitoring measures real production behavior, not just whether servers are alive.
- The most useful beginner signals are latency, traffic, error rate, saturation, and dependency health.
- Monitoring, logging, and tracing are complementary, and production teams usually need all three.
- Percentiles are more useful than averages for understanding user pain.
- Alerts should focus on sustained user impact, not every temporary metric fluctuation.
- Monitoring becomes much more valuable when it covers asynchronous workers and downstream dependencies too.
The next topic in this series covers Configuration Management Explained Simply - how teams keep settings consistent across environments without hardcoding them into application code.
If you want the best companion post for this topic, revisit How Logging Works in Backend Systems, because monitoring tells you that something is wrong while logging helps explain why.
References
-
What is application performance monitoring (APM)? - Google Cloud
https://cloud.google.com/discover/what-is-application-monitoring -
Signals - OpenTelemetry Documentation
https://opentelemetry.io/docs/concepts/signals/ -
Overview - Prometheus
https://prometheus.io/docs/introduction/overview/
YouTube Videos
-
“Application Performance Monitoring Explained.”
https://www.youtube.com/watch?v=356WBxUEkkE -
“How Prometheus Monitoring works | Prometheus Architecture explained”
https://www.youtube.com/watch?v=h4Sl21AKiDg -
“Observability and Its Pillars Explained | Logs, Metrics & Traces Simplified”
https://www.youtube.com/watch?v=rJfZyA831fI